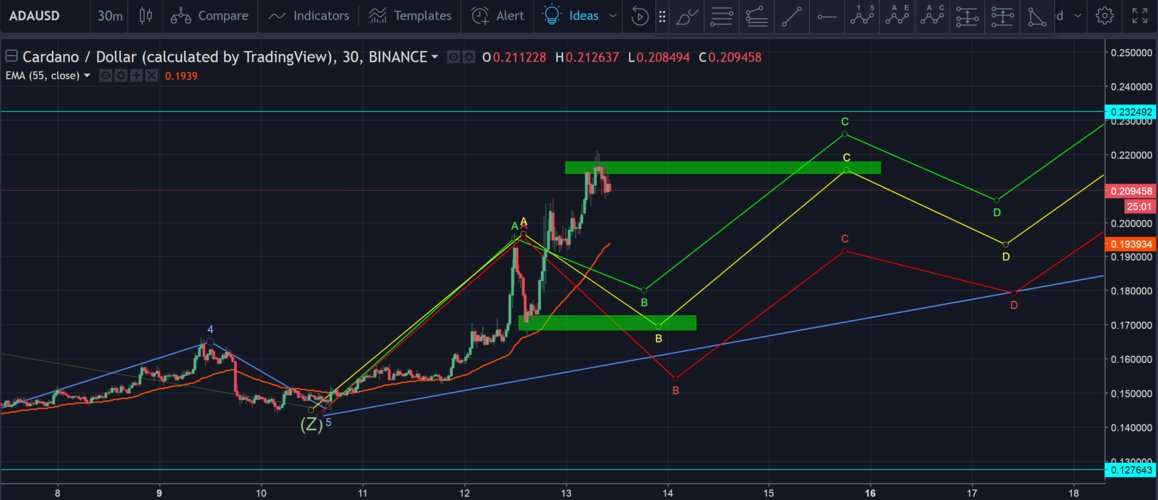
Understanding ADA ETH Technical Analysis: A Comprehensive Guide
When it comes to cryptocurrency trading, technical analysis plays a crucial role in helping traders make informed decisions. One such pair that has caught the attention of many is ADA ETH. In this article, we will delve into the technical analysis of ADA ETH, exploring various aspects that can help you understand the dynamics of this pair better.
Understanding ADA and ETH
Before we dive into the technical analysis, let’s take a quick look at ADA and ETH, the two cryptocurrencies that make up the ADA ETH pair.

ADA, also known as Cardano, is a blockchain platform that aims to offer a more secure, transparent, and sustainable alternative to traditional blockchain systems. It was founded by Charles Hoskinson, one of the co-founders of Ethereum. ADA is the native token of the Cardano network and is used for various purposes, including transaction fees, governance, and incentivizing network participants.
ETH, on the other hand, is the native token of the Ethereum network, which is one of the most popular and widely used blockchain platforms. ETH is used for various purposes, including paying for transaction fees, deploying smart contracts, and participating in the network’s governance.
Market Analysis
When analyzing the ADA ETH pair, it’s essential to consider the broader market conditions. Here are some key factors to keep in mind:
| Market Factor | Description |
|---|---|
| Bullish Market | When the overall market is trending upwards, it can be beneficial for ADA ETH as well. This is because a bullish market can lead to increased demand for cryptocurrencies, which can drive the price of ADA ETH higher. |
| Bearish Market | In contrast, a bearish market can have a negative impact on ADA ETH. This is because a bearish market can lead to decreased demand for cryptocurrencies, which can drive the price of ADA ETH lower. |
| Market Sentiment | Market sentiment can also play a significant role in the price of ADA ETH. For example, positive news about Cardano or Ethereum can lead to increased optimism and drive the price higher, while negative news can lead to increased pessimism and drive the price lower. |
Technical Indicators
Technical indicators are tools that traders use to analyze historical price data and identify potential trading opportunities. Here are some popular technical indicators that can be used to analyze the ADA ETH pair:

1. Moving Averages
Moving averages are one of the most popular technical indicators. They help traders identify the trend direction and strength. Here are some common moving averages used in ADA ETH analysis:
- Simple Moving Average (SMA)
- Exponential Moving Average (EMA)
- Weighted Moving Average (WMA)
2. Relative Strength Index (RSI)
The RSI is a momentum oscillator that measures the speed and change of price movements. It ranges from 0 to 100 and is used to identify overbought or oversold conditions. A reading above 70 is typically considered overbought, while a reading below 30 is typically considered oversold.
3. Bollinger Bands
Bollinger Bands consist of a middle band, an upper band, and a lower band. The middle band is a simple moving average, while the upper and lower bands are calculated using standard deviations. Bollinger Bands help traders identify potential overbought or oversold conditions and provide a range for price movement.
Chart Patterns
Chart patterns are visual representations of historical price data and can help traders identify potential trading opportunities. Here are some common chart patterns used in ADA ETH analysis:
- Trend Lines
- Support and Resistance
- Head and Shoulders
- Double Tops and Bottoms
Conclusion
Understanding the technical analysis of ADA ETH can help you make more informed trading decisions. By considering market conditions, technical indicators, and chart patterns, you can gain valuable insights into the potential price movements of this pair. However, it’s important to remember that technical analysis is just one tool in


